Axes
Qualified name: manim.mobject.graphing.coordinate\_systems.Axes
- class Axes(x_range=None, y_range=None, x_length=12, y_length=6, axis_config=None, x_axis_config=None, y_axis_config=None, tips=True, **kwargs)[source]
Bases:
VGroup,CoordinateSystemCreates a set of axes.
- Parameters:
x_range (Sequence[float] | None) – The
(x_min, x_max, x_step)values of the x-axis.y_range (Sequence[float] | None) – The
(y_min, y_max, y_step)values of the y-axis.x_length (float | None) – The length of the x-axis.
y_length (float | None) – The length of the y-axis.
axis_config (dict | None) – Arguments to be passed to
NumberLinethat influences both axes.x_axis_config (dict | None) – Arguments to be passed to
NumberLinethat influence the x-axis.y_axis_config (dict | None) – Arguments to be passed to
NumberLinethat influence the y-axis.tips (bool) – Whether or not to include the tips on both axes.
kwargs (Any) – Additional arguments to be passed to
CoordinateSystemandVGroup.
Examples
Example: LogScalingExample 
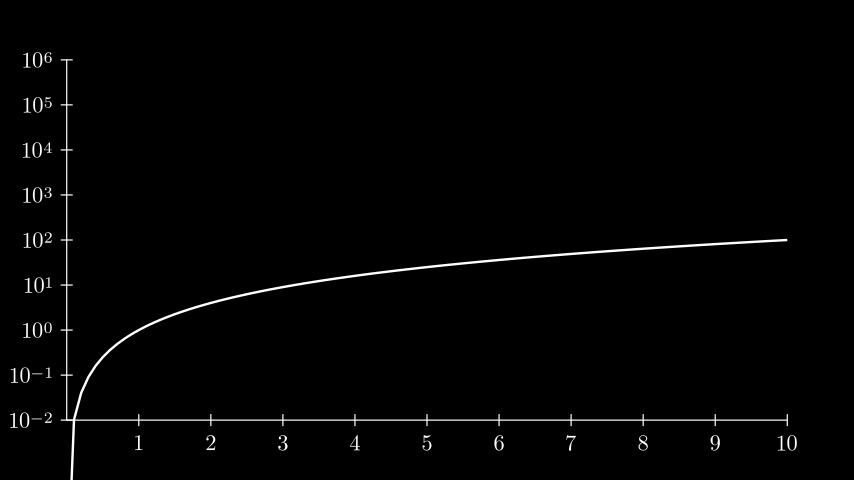
from manim import *

class LogScalingExample(Scene):
    def construct(self):
        ax = Axes(
            x_range=[0, 10, 1],
            y_range=[-2, 6, 1],
            tips=False,
            axis_config={"include_numbers": True},
            y_axis_config={"scaling": LogBase(custom_labels=True)},
        )

        # x_min must be > 0 because log is undefined at 0.
        graph = ax.plot(lambda x: x ** 2, x_range=[0.001, 10], use_smoothing=False)
        self.add(ax, graph)
Styling arguments can be passed to the underlying
NumberLinemobjects that represent the axes:Example: AxesWithDifferentTips 
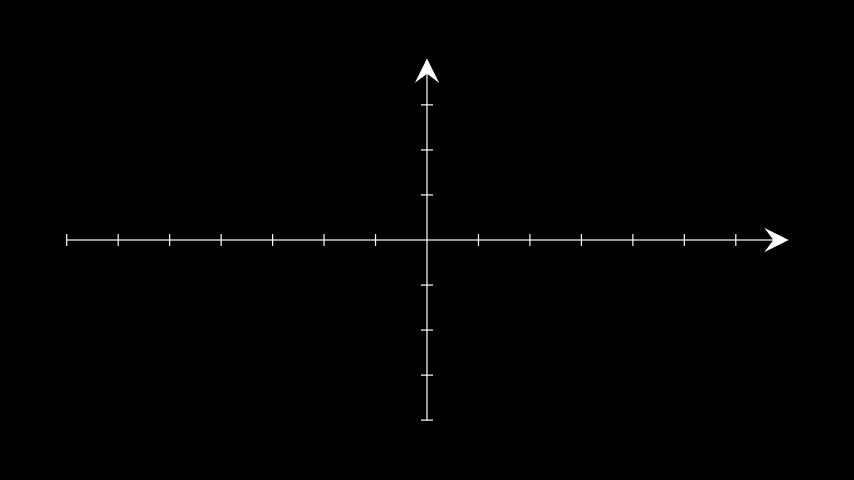
from manim import *

class AxesWithDifferentTips(Scene):
    def construct(self):
        ax = Axes(axis_config={'tip_shape': StealthTip})
        self.add(ax)
class AxesWithDifferentTips(Scene):
    def construct(self):
        ax = Axes(axis_config={'tip_shape': StealthTip})
        self.add(ax)
Methods
Accepts coordinates from the axes and returns a point with respect to the scene.
Gets the axes.
Defines labels for the x-axis and y-axis of the graph.
Draws a line graph.
Accepts a point from the scene and returns its coordinates with respect to the axes.
Attributes
alwaysCall a method on a mobject every frame.
animateUsed to animate the application of any method of
self.animation_overridescolordepthThe depth of the mobject.
fill_colorIf there are multiple colors (for gradient) this returns the first one
heightThe height of the mobject.
n_points_per_curvesheen_factorstroke_colorwidthThe width of the mobject.
- _create_axis(range_terms, axis_config, length)[source]
Creates an axis and dynamically adjusts its position depending on where 0 is located on the line.
- Parameters:
range_terms (Sequence[float]) – The range of the the axis :
(x_min, x_max, x_step).axis_config (dict[str, Any]) – Additional parameters that are passed to
NumberLine.length (float) – The length of the axis.
- Returns:
Returns a number line based on
range_terms.- Return type:
NumberLine
- static _origin_shift(axis_range)[source]
Determines how to shift graph mobjects to compensate when 0 is not on the axis.
- Parameters:
axis_range (Sequence[float]) – The range of the axis :
(x_min, x_max, x_step).- Return type:
float
- _original__init__(x_range=None, y_range=None, x_length=12, y_length=6, axis_config=None, x_axis_config=None, y_axis_config=None, tips=True, **kwargs)
Initialize self. See help(type(self)) for accurate signature.
- Parameters:
x_range (Sequence[float] | None)
y_range (Sequence[float] | None)
x_length (float | None)
y_length (float | None)
axis_config (dict | None)
x_axis_config (dict | None)
y_axis_config (dict | None)
tips (bool)
kwargs (Any)
- static _update_default_configs(default_configs, passed_configs)[source]
Takes in two tuples of dicts and return modifies the first such that values from
passed_configsoverwrite values indefault_configs. If a key does not exist in default_configs, it is added to the dict.This method is useful for having defaults in a class and being able to overwrite them with user-defined input.
- Parameters:
default_configs (tuple[dict[Any, Any]]) – The dict that will be updated.
passed_configs (tuple[dict[Any, Any]]) – The dict that will be used to update.
- Return type:
None
Examples
To create a tuple with one dictionary, add a comma after the element:
self._update_default_configs(
    (dict_1,)(
        dict_2,
    )
)
- coords_to_point(*coords)[source]
Accepts coordinates from the axes and returns a point with respect to the scene. Equivalent to ax @ (coord1)
- Parameters:
coords (float | Sequence[float] | Sequence[Sequence[float]] | ndarray) –
The coordinates. Each coord is passed as a separate argument:
ax.coords_to_point(1, 2, 3).Also accepts a list of coordinates
ax.coords_to_point( [x_0, x_1, ...], [y_0, y_1, ...], ... )ax.coords_to_point( [[x_0, y_0, z_0], [x_1, y_1, z_1]] )A single coordinate can also be passed as a flat list or 1D array:
ax.coords_to_point( [x, y, z] )- Returns:
A point with respect to the scene’s coordinate system. The shape of the array will be similar to the shape of the input.
- Return type:
np.ndarray
Examples
>>> from manim import Axes
>>> import numpy as np
>>> ax = Axes()
>>> np.around(ax.coords_to_point(1, 0, 0), 2)
array([0.86, 0.  , 0.  ])
>>> np.around(ax @ (1, 0, 0), 2)
array([0.86, 0.  , 0.  ])
>>> np.around(ax.coords_to_point([[0, 1], [1, 1], [1, 0]]), 2)
array([[0.  , 0.75, 0.  ],
       [0.86, 0.75, 0.  ],
       [0.86, 0.  , 0.  ]])
>>> np.around(
...     ax.coords_to_point([0, 1, 1], [1, 1, 0]), 2
... )  # Transposed version of the above
array([[0.  , 0.86, 0.86],
       [0.75, 0.75, 0.  ],
       [0.  , 0.  , 0.  ]])
>>> np.around(ax.coords_to_point([1, 0, 0]), 2)
array([0.86, 0.  , 0.  ])
>>> np.around(ax.coords_to_point(np.array([1, 0])), 2)
array([0.86, 0.  , 0.  ])
Example: CoordsToPointExample 
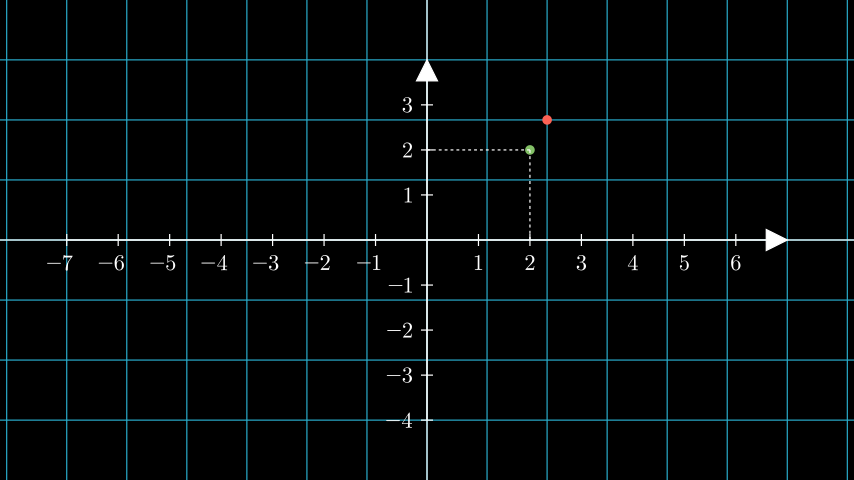
from manim import *

class CoordsToPointExample(Scene):
    def construct(self):
        ax = Axes().add_coordinates()

        # a dot with respect to the axes
        dot_axes = Dot(ax.coords_to_point(2, 2), color=GREEN)
        lines = ax.get_lines_to_point(ax.c2p(2,2))

        # a dot with respect to the scene
        # the default plane corresponds to the coordinates of the scene.
        plane = NumberPlane()
        dot_scene = Dot((2,2,0), color=RED)

        self.add(plane, dot_scene, ax, dot_axes, lines)
- get_axis_labels(x_label='x', y_label='y')[source]
Defines labels for the x-axis and y-axis of the graph.
For increased control over the position of the labels, use
get_x_axis_label()andget_y_axis_label().- Parameters:
- Returns:
A
VGroupof the labels for the x_axis and y_axis.- Return type:
See also
Examples
Example: GetAxisLabelsExample 
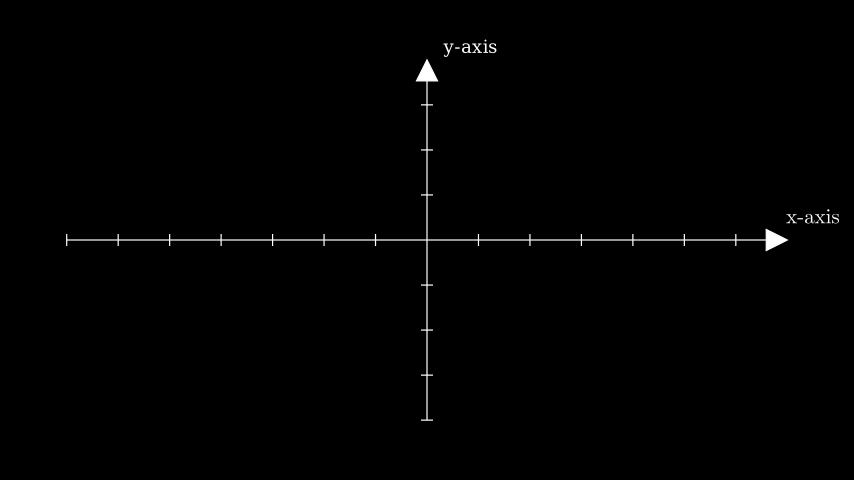
from manim import *

class GetAxisLabelsExample(Scene):
    def construct(self):
        ax = Axes()
        labels = ax.get_axis_labels(
            Tex("x-axis").scale(0.7), Text("y-axis").scale(0.45)
        )
        self.add(ax, labels)
class GetAxisLabelsExample(Scene):
    def construct(self):
        ax = Axes()
        labels = ax.get_axis_labels(
            Tex("x-axis").scale(0.7), Text("y-axis").scale(0.45)
        )
        self.add(ax, labels)
- plot_line_graph(x_values, y_values, z_values=None, line_color=ManimColor('#FFFF00'), add_vertex_dots=True, vertex_dot_radius=0.08, vertex_dot_style=None, **kwargs)[source]
Draws a line graph.
The graph connects the vertices formed from zipping
x_values,y_valuesandz_values. Also addsDotsat the vertices ifadd_vertex_dotsis set toTrue.- Parameters:
x_values (Iterable[float]) – Iterable of values along the x-axis.
y_values (Iterable[float]) – Iterable of values along the y-axis.
z_values (Iterable[float] | None) – Iterable of values (zeros if z_values is None) along the z-axis.
line_color (ParsableManimColor) – Color for the line graph.
add_vertex_dots (bool) – Whether or not to add
Dotat each vertex.vertex_dot_radius (float) – Radius for the
Dotat each vertex.vertex_dot_style (dict[str, Any] | None) – Style arguments to be passed into
Dotat each vertex.kwargs (Any) – Additional arguments to be passed into
VMobject.
- Returns:
A VDict containing both the line and dots (if specified). The line can be accessed with:
line_graph["line_graph"]. The dots can be accessed with:line_graph["vertex_dots"].- Return type:
Examples
Example: LineGraphExample 
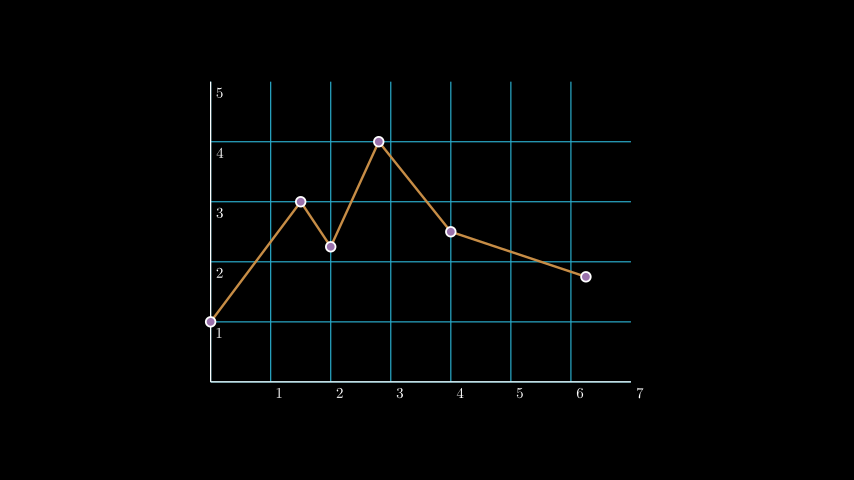
from manim import *

class LineGraphExample(Scene):
    def construct(self):
        plane = NumberPlane(
            x_range = (0, 7),
            y_range = (0, 5),
            x_length = 7,
            axis_config={"include_numbers": True},
        )
        plane.center()
        line_graph = plane.plot_line_graph(
            x_values = [0, 1.5, 2, 2.8, 4, 6.25],
            y_values = [1, 3, 2.25, 4, 2.5, 1.75],
            line_color=GOLD_E,
            vertex_dot_style=dict(stroke_width=3,  fill_color=PURPLE),
            stroke_width = 4,
        )
        self.add(plane, line_graph)
- point_to_coords(point)[source]
Accepts a point from the scene and returns its coordinates with respect to the axes.
- Parameters:
point (Sequence[float]) – The point, i.e.
RIGHTor[0, 1, 0]. Also accepts a list of points as[RIGHT, [0, 1, 0]].- Returns:
The coordinates on the axes, i.e.
[4.0, 7.0]. Or a list of coordinates if point is a list of points.- Return type:
np.ndarray[float]
Examples
>>> from manim import Axes, RIGHT
>>> import numpy as np
>>> ax = Axes(x_range=[0, 10, 2])
>>> np.around(ax.point_to_coords(RIGHT), 2)
array([5.83, 0.  ])
>>> np.around(ax.point_to_coords([[0, 0, 1], [1, 0, 0]]), 2)
array([[5.  , 0.  ],
       [5.83, 0.  ]])
Example: PointToCoordsExample 
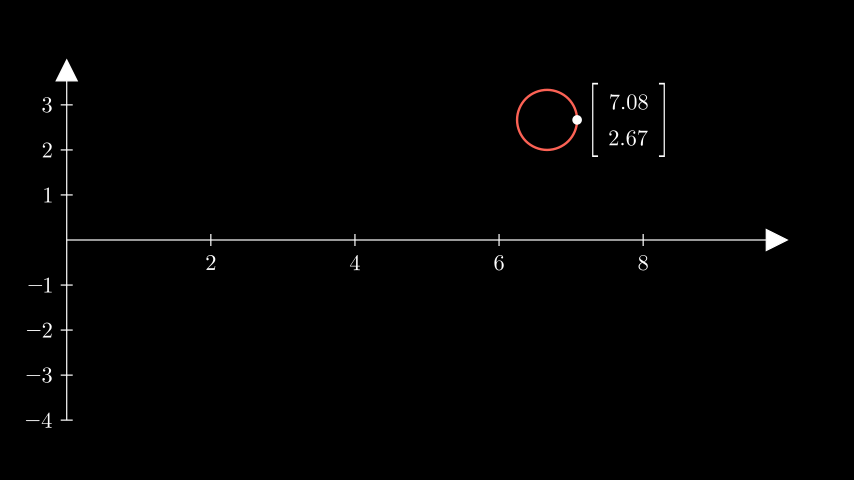
from manim import *

class PointToCoordsExample(Scene):
    def construct(self):
        ax = Axes(x_range=[0, 10, 2]).add_coordinates()
        circ = Circle(radius=0.5).shift(UR * 2)

        # get the coordinates of the circle with respect to the axes
        coords = np.around(ax.point_to_coords(circ.get_right()), decimals=2)

        label = (
            Matrix([[coords[0]], [coords[1]]]).scale(0.75).next_to(circ, RIGHT)
        )

        self.add(ax, circ, label, Dot(circ.get_right()))