CoordinateSystem
Qualified name: manim.mobject.graphing.coordinate\_systems.CoordinateSystem
- class CoordinateSystem(x_range=None, y_range=None, x_length=None, y_length=None, dimension=2)[source]
Bases:
objectAbstract base class for Axes and NumberPlane.
Examples
Example: CoordSysExample 
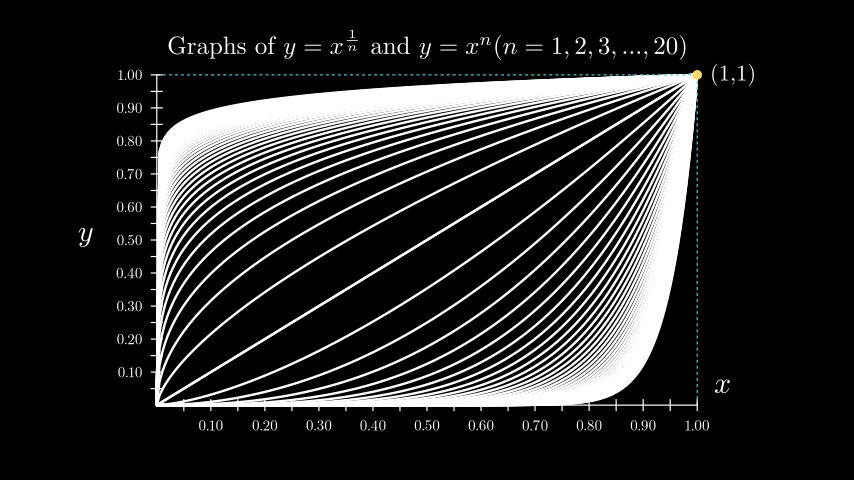
from manim import *

class CoordSysExample(Scene):
    def construct(self):
        # the location of the ticks depends on the x_range and y_range.
        grid = Axes(
            x_range=[0, 1, 0.05],  # step size determines num_decimal_places.
            y_range=[0, 1, 0.05],
            x_length=9,
            y_length=5.5,
            axis_config={
                "numbers_to_include": np.arange(0, 1 + 0.1, 0.1),
                "font_size": 24,
            },
            tips=False,
        )

        # Labels for the x-axis and y-axis.
        y_label = grid.get_y_axis_label("y", edge=LEFT, direction=LEFT, buff=0.4)
        x_label = grid.get_x_axis_label("x")
        grid_labels = VGroup(x_label, y_label)

        graphs = VGroup()
        for n in np.arange(1, 20 + 0.5, 0.5):
            graphs += grid.plot(lambda x: x ** n, color=WHITE)
            graphs += grid.plot(
                lambda x: x ** (1 / n), color=WHITE, use_smoothing=False
            )

        # Extra lines and labels for point (1,1)
        graphs += grid.get_horizontal_line(grid @ (1, 1, 0), color=BLUE)
        graphs += grid.get_vertical_line(grid @ (1, 1, 0), color=BLUE)
        graphs += Dot(point=grid @ (1, 1, 0), color=YELLOW)
        graphs += Tex("(1,1)").scale(0.75).next_to(grid @ (1, 1, 0))
        title = Title(
            # spaces between braces to prevent SyntaxError
            r"Graphs of $y=x^{ {1}\over{n} }$ and $y=x^n (n=1,2,3,...,20)$",
            include_underline=False,
            font_size=40,
        )

        self.add(title, graphs, grid, grid_labels)
Methods
Adds labels to the axes.
Returns the angle to the x-axis of the tangent to the plotted curve at a particular x-value.
Abbreviation for
coords_to_point()coords_to_pointCreates a labelled triangle marker with a vertical line from the x-axis to a curve at a given x-value.
Returns a
Polygonrepresenting the area under the graph passed.get_axesget_axisget_axis_labelsCreates a properly positioned label for the passed graph, with an optional dot.
A horizontal line from the y-axis to a given point in the scene.
Returns a straight line from a given axis to a point in the scene.
Generate both horizontal and vertical lines from the axis to a point.
Gets the origin of
Axes.Generates a
VGroupof the Riemann Rectangles for a given curve.Creates two lines representing dx and df, the labels for dx and df, and
A vertical line from the x-axis to a given point in the scene.
Obtains multiple lines from the x-axis to the curve.
get_x_axisGenerate an x-axis label.
get_x_unit_sizeget_y_axisGenerate a y-axis label.
get_y_unit_sizeget_z_axisAlias for
input_to_graph_coords().Alias for
input_to_graph_point().Returns a tuple of the axis relative coordinates of the point on the graph based on the x-value given.
Returns the coordinates of the point on a
graphcorresponding to anxvalue.Abbreviation for
point_to_coords()Generates a curve based on a function.
Plots an antiderivative graph.
Returns the curve of the derivative of the passed graph.
Creates the curves of an implicit function.
A parametric curve.
A polar graph.
Generates a surface based on a function.
point_to_coordsGets polar coordinates from a point.
Gets a point from polar coordinates.
Abbreviation for
polar_to_point()Abbreviation for
point_to_polar()Returns the slope of the tangent to the plotted curve at a particular x-value.
- Parameters:
x_range (Sequence[float] | None)
y_range (Sequence[float] | None)
x_length (float | None)
y_length (float | None)
dimension (int)
- _get_axis_label(label, axis, edge, direction, buff=0.1)[source]
Gets the label for an axis.
- Parameters:
label (float | str | VMobject) – The label. Defaults to
MathTexforstrandfloatinputs.axis (Mobject) – The axis to which the label will be added.
edge (Vector3DLike) – The edge of the axes to which the label will be added.
RIGHTadds to the right side of the axisdirection (Vector3DLike) – Allows for further positioning of the label.
buff (float) – The distance of the label from the line.
- Returns:
The positioned label along the given axis.
- Return type:
- add_coordinates(*axes_numbers, **kwargs)[source]
Adds labels to the axes. Use
Axes.coordinate_labelsto access the coordinates after creation.- Parameters:
axes_numbers (Iterable[float] | None | dict[float, str | float | Mobject]) – The numbers to be added to the axes. Use
Noneto represent an axis with default labels.kwargs (Any)
- Return type:
Self
Examples
ax = ThreeDAxes()
x_labels = range(-4, 5)
z_labels = range(-4, 4, 2)
ax.add_coordinates(
    x_labels, None, z_labels
)  # default y labels, custom x & z labels
ax.add_coordinates(x_labels)  # only x labels
You can also specifically control the position and value of the labels using a dict.
ax = Axes(x_range=[0, 7])
x_pos = [x for x in range(1, 8)]

# strings are automatically converted into a Tex mobject.
x_vals = [
    "Monday",
    "Tuesday",
    "Wednesday",
    "Thursday",
    "Friday",
    "Saturday",
    "Sunday",
]
x_dict = dict(zip(x_pos, x_vals))
ax.add_coordinates(x_dict)
- angle_of_tangent(x, graph, dx=1e-08)[source]
Returns the angle to the x-axis of the tangent to the plotted curve at a particular x-value.
- Parameters:
x (float) – The x-value at which the tangent must touch the curve.
graph (ParametricFunction) – The
ParametricFunctionfor which to calculate the tangent.dx (float) – The change in x used to determine the angle of the tangent to the curve.
- Returns:
The angle of the tangent to the curve.
- Return type:
float
Examples
ax = Axes()
curve = ax.plot(lambda x: x**2)
ax.angle_of_tangent(x=3, graph=curve)
# 1.4056476493802699
- c2p(*coords)[source]
Abbreviation for
coords_to_point()- Parameters:
coords (float | Sequence[float] | Sequence[Sequence[float]] | ndarray)
- Return type:
ndarray
- get_T_label(x_val, graph, label=None, label_color=None, triangle_size=0.25, triangle_color=ManimColor('#FFFFFF'), line_func=<class 'manim.mobject.geometry.line.Line'>, line_color=ManimColor('#FFFF00'))[source]
Creates a labelled triangle marker with a vertical line from the x-axis to a curve at a given x-value.
- Parameters:
x_val (float) – The position along the curve at which the label, line and triangle will be constructed.
graph (ParametricFunction) – The
ParametricFunctionfor which to construct the label.label (float | str | Mobject | None) – The label of the vertical line and triangle.
label_color (TypeAliasForwardRef('~manim.utils.color.core.ParsableManimColor') | None) – The color of the label.
triangle_size (float) – The size of the triangle.
triangle_color (TypeAliasForwardRef('~manim.utils.color.core.ParsableManimColor') | None) – The color of the triangle.
line_func (type[Line]) – The function used to construct the vertical line.
line_color (ParsableManimColor) – The color of the vertical line.
- Returns:
A
VGroupof the label, triangle and vertical line mobjects.- Return type:
Examples
Example: TLabelExample 
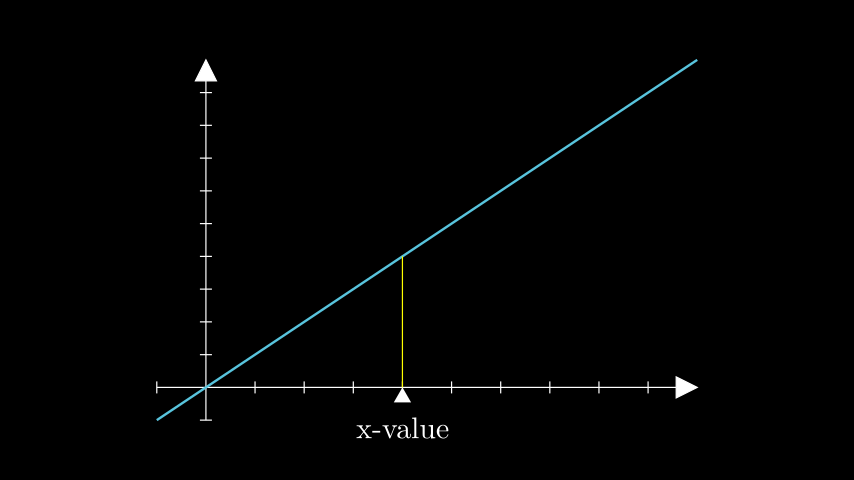
from manim import *

class TLabelExample(Scene):
    def construct(self):
        # defines the axes and linear function
        axes = Axes(x_range=[-1, 10], y_range=[-1, 10], x_length=9, y_length=6)
        func = axes.plot(lambda x: x, color=BLUE)
        # creates the T_label
        t_label = axes.get_T_label(x_val=4, graph=func, label=Tex("x-value"))
        self.add(axes, func, t_label)
- get_area(graph, x_range=None, color=(ManimColor('#58C4DD'), ManimColor('#83C167')), opacity=0.3, bounded_graph=None, **kwargs)[source]
Returns a
Polygonrepresenting the area under the graph passed.- Parameters:
graph (ParametricFunction) – The graph/curve for which the area needs to be gotten.
x_range (tuple[float, float] | None) – The range of the minimum and maximum x-values of the area.
x_range = [x_min, x_max].color (TypeAliasForwardRef('~manim.utils.color.core.ParsableManimColor') | Iterable[TypeAliasForwardRef('~manim.utils.color.core.ParsableManimColor')]) – The color of the area. Creates a gradient if a list of colors is provided.
opacity (float) – The opacity of the area.
bounded_graph (ParametricFunction | None) – If a secondary
graphis specified, encloses the area between the two curves.kwargs (Any) – Additional parameters passed to
Polygon.
- Returns:
The
Polygonrepresenting the area.- Return type:
- Raises:
ValueError – When x_ranges do not match (either area x_range, graph’s x_range or bounded_graph’s x_range).
Examples
Example: GetAreaExample 
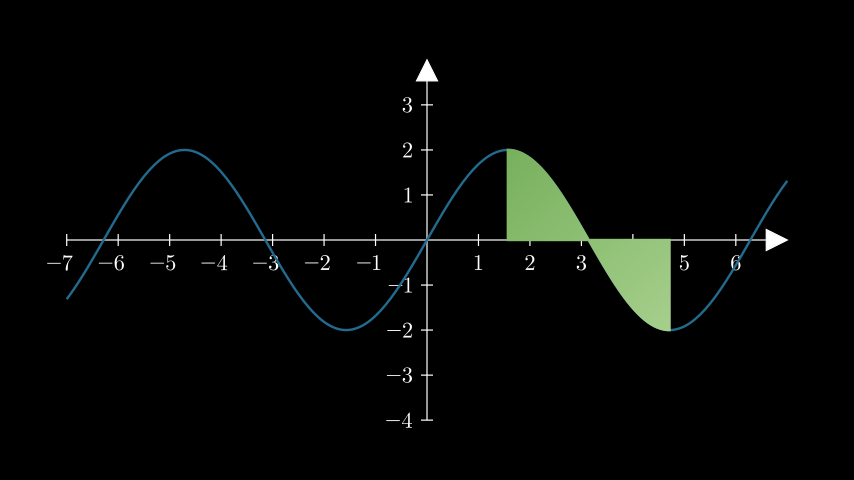
from manim import *

class GetAreaExample(Scene):
    def construct(self):
        ax = Axes().add_coordinates()
        curve = ax.plot(lambda x: 2 * np.sin(x), color=DARK_BLUE)
        area = ax.get_area(
            curve,
            x_range=(PI / 2, 3 * PI / 2),
            color=(GREEN_B, GREEN_D),
            opacity=1,
        )

        self.add(ax, curve, area)
- get_graph_label(graph, label='f(x)', x_val=None, direction=array([1., 0., 0.]), buff=0.25, color=None, dot=False, dot_config=None)[source]
Creates a properly positioned label for the passed graph, with an optional dot.
- Parameters:
graph (ParametricFunction) – The curve.
label (float | str | VMobject) – The label for the function’s curve. Defaults to
MathTexforstrandfloatinputs.x_val (float | None) – The x_value along the curve that positions the label.
direction (Sequence[float]) – The cartesian position, relative to the curve that the label will be at –>
LEFT,RIGHT.buff (float) – The distance between the curve and the label.
color (TypeAliasForwardRef('~manim.utils.color.core.ParsableManimColor') | None) – The color of the label. Defaults to the color of the curve.
dot (bool) – Whether to add a dot at the point on the graph.
dot_config (dict[str, Any] | None) – Additional parameters to be passed to
Dot.
- Returns:
The positioned label and
Dot, if applicable.- Return type:
Mobject
Examples
Example: GetGraphLabelExample 
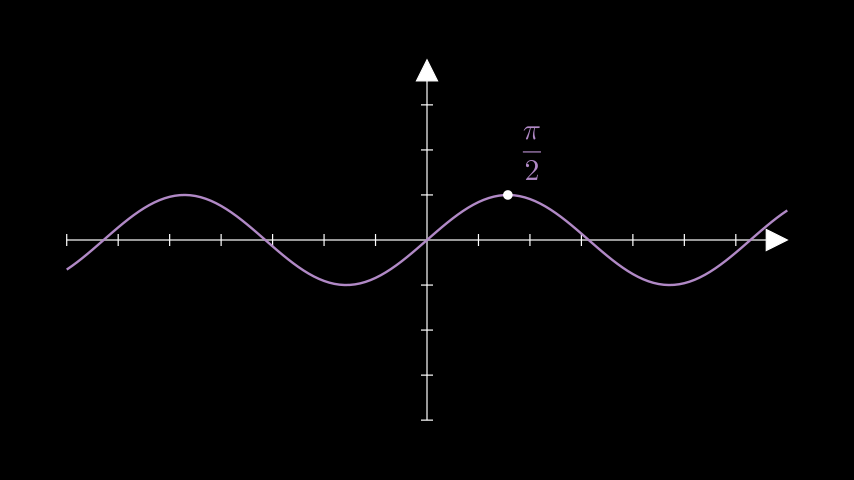
from manim import *

class GetGraphLabelExample(Scene):
    def construct(self):
        ax = Axes()
        sin = ax.plot(lambda x: np.sin(x), color=PURPLE_B)
        label = ax.get_graph_label(
            graph=sin,
            label= MathTex(r"\frac{\pi}{2}"),
            x_val=PI / 2,
            dot=True,
            direction=UR,
        )

        self.add(ax, sin, label)
- get_horizontal_line(point, **kwargs)[source]
A horizontal line from the y-axis to a given point in the scene.
- Parameters:
point (Point3DLike) – The point to which the horizontal line will be drawn.
kwargs (Any) – Additional parameters to be passed to
get_line_from_axis_to_point.
- Returns:
A horizontal line from the y-axis to the point.
- Return type:
Line
Examples
Example: GetHorizontalLineExample 
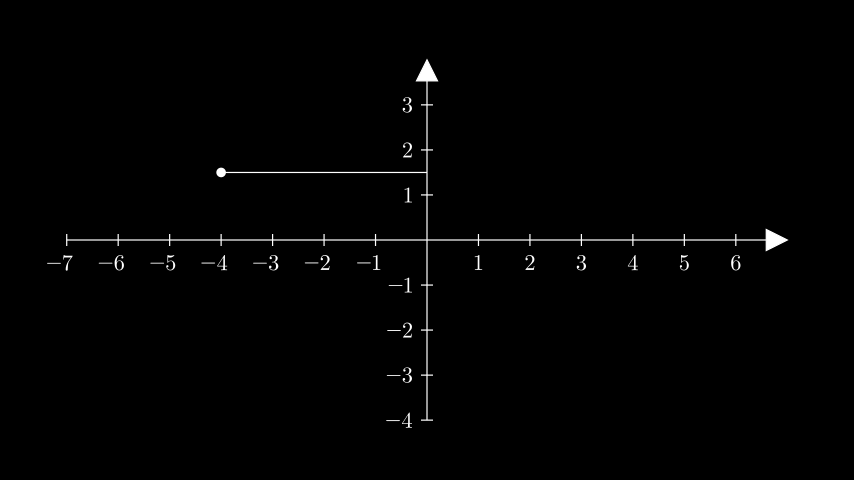
from manim import *

class GetHorizontalLineExample(Scene):
    def construct(self):
        ax = Axes().add_coordinates()
        point = ax @ (-4, 1.5)

        dot = Dot(point)
        line = ax.get_horizontal_line(point, line_func=Line)

        self.add(ax, line, dot)
class GetHorizontalLineExample(Scene):
    def construct(self):
        ax = Axes().add_coordinates()
        point = ax @ (-4, 1.5)

        dot = Dot(point)
        line = ax.get_horizontal_line(point, line_func=Line)

        self.add(ax, line, dot)
- get_line_from_axis_to_point(index: int, point: Point3DLike, line_config: dict | None = None, color: ParsableManimColor | None = None, stroke_width: float = 2) DashedLine[source]
- get_line_from_axis_to_point(index: int, point: Point3DLike, line_func: type[LineType], line_config: dict | None = None, color: ParsableManimColor | None = None, stroke_width: float = 2) LineType
Returns a straight line from a given axis to a point in the scene.
- Parameters:
index – Specifies the axis from which to draw the line. 0 = x_axis, 1 = y_axis
point – The point to which the line will be drawn.
line_func – The function of the
Linemobject used to construct the line.line_config – Optional arguments to passed to
line_func.color – The color of the line.
stroke_width – The stroke width of the line.
- Returns:
The line from an axis to a point.
- Return type:
See also
- get_lines_to_point(point, **kwargs)[source]
Generate both horizontal and vertical lines from the axis to a point.
- Parameters:
point (Point3DLike) – A point on the scene.
kwargs (Any) – Additional parameters to be passed to
get_line_from_axis_to_point()
- Returns:
A
VGroupof the horizontal and vertical lines.- Return type:
See also
Examples
Example: GetLinesToPointExample 
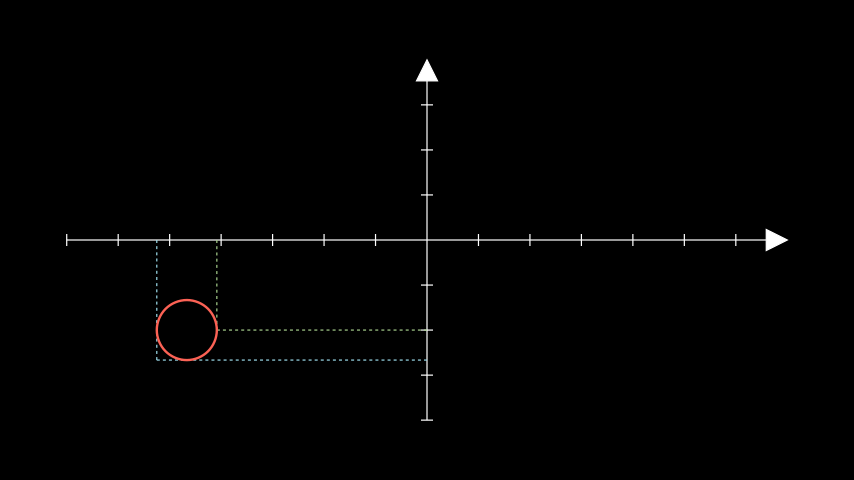
from manim import *

class GetLinesToPointExample(Scene):
    def construct(self):
        ax = Axes()
        circ = Circle(radius=0.5).move_to([-4, -1.5, 0])

        lines_1 = ax.get_lines_to_point(circ.get_right(), color=GREEN_B)
        lines_2 = ax.get_lines_to_point(circ.get_corner(DL), color=BLUE_B)
        self.add(ax, lines_1, lines_2, circ)
- get_riemann_rectangles(graph, x_range=None, dx=0.1, input_sample_type='left', stroke_width=1, stroke_color=ManimColor('#000000'), fill_opacity=1, color=(ManimColor('#58C4DD'), ManimColor('#83C167')), show_signed_area=True, bounded_graph=None, blend=False, width_scale_factor=1.001)[source]
Generates a
VGroupof the Riemann Rectangles for a given curve.- Parameters:
graph (ParametricFunction) – The graph whose area will be approximated by Riemann rectangles.
x_range (Sequence[float] | None) – The minimum and maximum x-values of the rectangles.
x_range = [x_min, x_max].dx (float) – The change in x-value that separates each rectangle.
input_sample_type (str) – Can be any of
"left","right"or"center". Refers to where the sample point for the height of each Riemann Rectangle will be inside the segments of the partition.stroke_width (float) – The stroke_width of the border of the rectangles.
stroke_color (ParsableManimColor) – The color of the border of the rectangle.
fill_opacity (float) – The opacity of the rectangles.
color (Iterable[TypeAliasForwardRef('~manim.utils.color.core.ParsableManimColor')] | TypeAliasForwardRef('~manim.utils.color.core.ParsableManimColor')) – The colors of the rectangles. Creates a balanced gradient if multiple colors are passed.
show_signed_area (bool) – Indicates negative area when the curve dips below the x-axis by inverting its color.
blend (bool) – Sets the
stroke_colortofill_color, blending the rectangles without clear separation.bounded_graph (ParametricFunction | None) – If a secondary graph is specified, encloses the area between the two curves.
width_scale_factor (float) – The factor by which the width of the rectangles is scaled.
- Returns:
A
VGroupcontaining the Riemann Rectangles.- Return type:
Examples
Example: GetRiemannRectanglesExample 
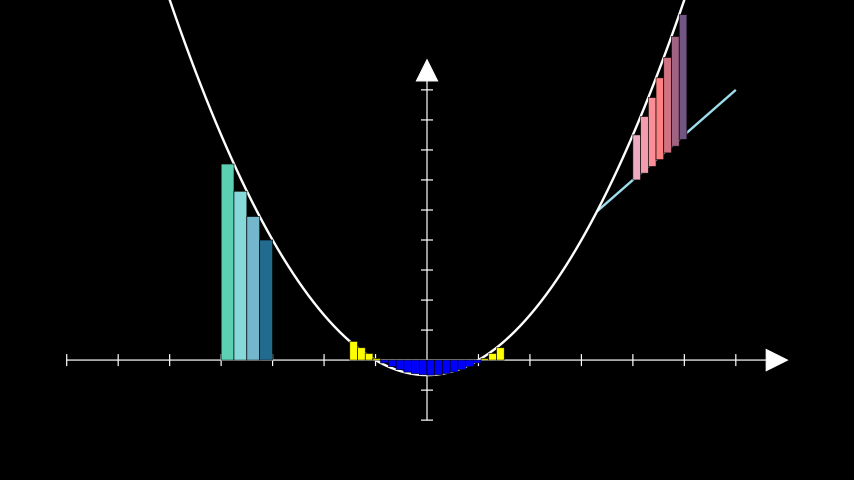
from manim import *

class GetRiemannRectanglesExample(Scene):
    def construct(self):
        ax = Axes(y_range=[-2, 10])
        quadratic = ax.plot(lambda x: 0.5 * x ** 2 - 0.5)

        # the rectangles are constructed from their top right corner.
        # passing an iterable to `color` produces a gradient
        rects_right = ax.get_riemann_rectangles(
            quadratic,
            x_range=[-4, -3],
            dx=0.25,
            color=(TEAL, BLUE_B, DARK_BLUE),
            input_sample_type="right",
        )

        # the colour of rectangles below the x-axis is inverted
        # due to show_signed_area
        rects_left = ax.get_riemann_rectangles(
            quadratic, x_range=[-1.5, 1.5], dx=0.15, color=YELLOW
        )

        bounding_line = ax.plot(
            lambda x: 1.5 * x, color=BLUE_B, x_range=[3.3, 6]
        )
        bounded_rects = ax.get_riemann_rectangles(
            bounding_line,
            bounded_graph=quadratic,
            dx=0.15,
            x_range=[4, 5],
            show_signed_area=False,
            color=(MAROON_A, RED_B, PURPLE_D),
        )

        self.add(
            ax, bounding_line, quadratic, rects_right, rects_left, bounded_rects
        )
- get_secant_slope_group(x, graph, dx=None, dx_line_color=ManimColor('#FFFF00'), dy_line_color=None, dx_label=None, dy_label=None, include_secant_line=True, secant_line_color=ManimColor('#83C167'), secant_line_length=10)[source]
- Creates two lines representing dx and df, the labels for dx and df, and
the secant to the curve at a particular x-value.
- Parameters:
x (float) – The x-value at which the secant intersects the graph for the first time.
graph (ParametricFunction) – The curve for which the secant will be found.
dx (float | None) – The change in x after which the secant exits.
dx_line_color (ParsableManimColor) – The color of the line that indicates the change in x.
dy_line_color (TypeAliasForwardRef('~manim.utils.color.core.ParsableManimColor') | None) – The color of the line that indicates the change in y. Defaults to the color of
graph.dx_label (float | str | None) – The label for the dx line. Defaults to
MathTexforstrandfloatinputs.dy_label (float | str | None) – The label for the dy line. Defaults to
MathTexforstrandfloatinputs.include_secant_line (bool) – Whether to include the secant line in the graph, or just the df/dx lines and labels.
secant_line_color (ParsableManimColor) – The color of the secant line.
secant_line_length (float) – The length of the secant line.
- Returns:
A group containing the elements: dx_line, df_line, and if applicable also
dx_label,df_label, secant_line.- Return type:
Examples
Example: GetSecantSlopeGroupExample 
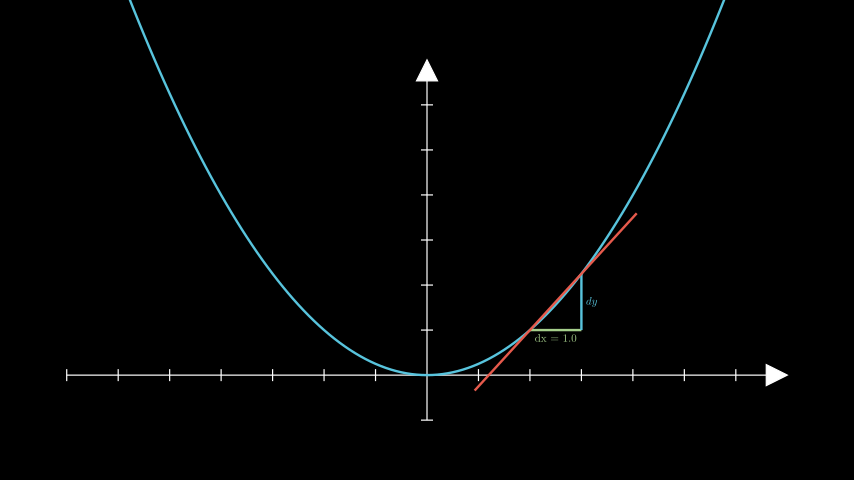
from manim import *

class GetSecantSlopeGroupExample(Scene):
    def construct(self):
        ax = Axes(y_range=[-1, 7])
        graph = ax.plot(lambda x: 1 / 4 * x ** 2, color=BLUE)
        slopes = ax.get_secant_slope_group(
            x=2.0,
            graph=graph,
            dx=1.0,
            dx_label=Tex("dx = 1.0"),
            dy_label="dy",
            dx_line_color=GREEN_B,
            secant_line_length=4,
            secant_line_color=RED_D,
        )

        self.add(ax, graph, slopes)
- get_vertical_line(point, **kwargs)[source]
A vertical line from the x-axis to a given point in the scene.
- Parameters:
point (Point3DLike) – The point to which the vertical line will be drawn.
kwargs (Any) – Additional parameters to be passed to
get_line_from_axis_to_point.
- Returns:
A vertical line from the x-axis to the point.
- Return type:
Line
Examples
Example: GetVerticalLineExample 
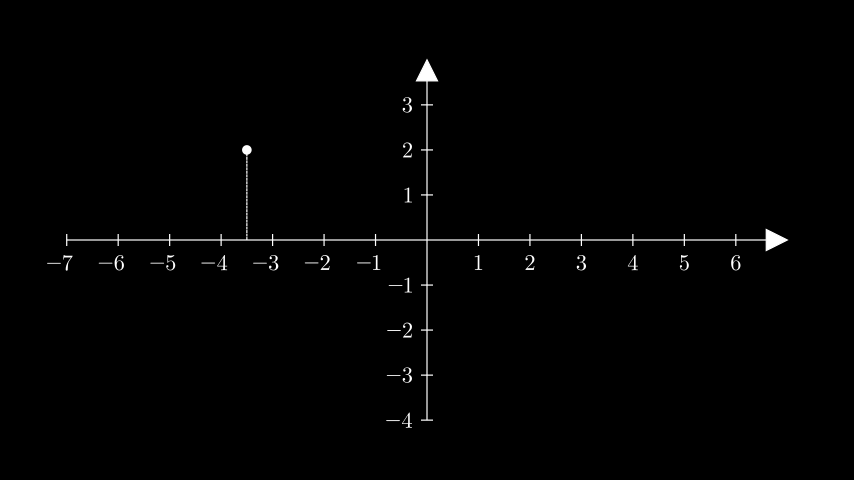
from manim import *

class GetVerticalLineExample(Scene):
    def construct(self):
        ax = Axes().add_coordinates()
        point = ax.coords_to_point(-3.5, 2)

        dot = Dot(point)
        line = ax.get_vertical_line(point, line_config={"dashed_ratio": 0.85})

        self.add(ax, line, dot)
class GetVerticalLineExample(Scene):
    def construct(self):
        ax = Axes().add_coordinates()
        point = ax.coords_to_point(-3.5, 2)

        dot = Dot(point)
        line = ax.get_vertical_line(point, line_config={"dashed_ratio": 0.85})

        self.add(ax, line, dot)
- get_vertical_lines_to_graph(graph, x_range=None, num_lines=20, **kwargs)[source]
Obtains multiple lines from the x-axis to the curve.
- Parameters:
graph (ParametricFunction) – The graph along which the lines are placed.
x_range (Sequence[float] | None) – A list containing the lower and and upper bounds of the lines:
x_range = [x_min, x_max].num_lines (int) – The number of evenly spaced lines.
kwargs (Any) – Additional arguments to be passed to
get_vertical_line().
- Returns:
The
VGroupof the evenly spaced lines.- Return type:
Examples
Example: GetVerticalLinesToGraph 
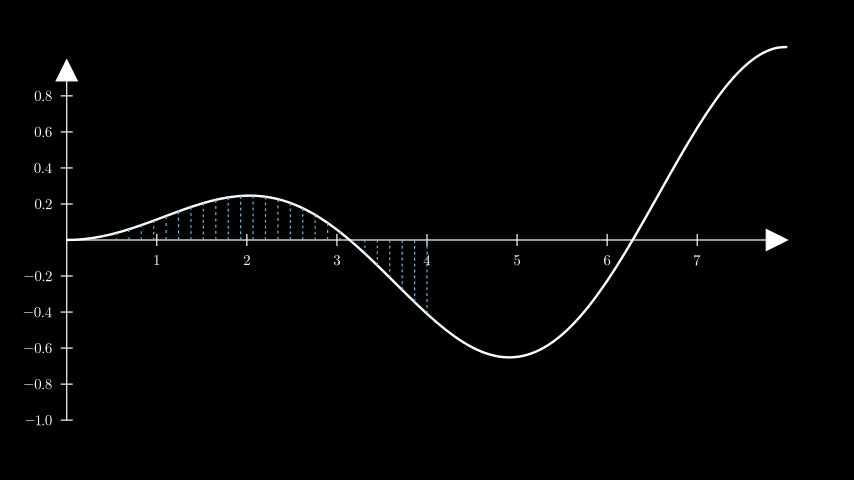
from manim import *

class GetVerticalLinesToGraph(Scene):
    def construct(self):
        ax = Axes(
            x_range=[0, 8.0, 1],
            y_range=[-1, 1, 0.2],
            axis_config={"font_size": 24},
        ).add_coordinates()

        curve = ax.plot(lambda x: np.sin(x) / np.e ** 2 * x)

        lines = ax.get_vertical_lines_to_graph(
            curve, x_range=[0, 4], num_lines=30, color=BLUE
        )

        self.add(ax, curve, lines)
- get_x_axis_label(label, edge=array([1., 1., 0.]), direction=array([1., 1., 0.]), buff=0.1, **kwargs)[source]
Generate an x-axis label.
- Parameters:
label (float | str | VMobject) – The label. Defaults to
MathTexforstrandfloatinputs.edge (Vector3D) – The edge of the x-axis to which the label will be added, by default
UR.direction (Vector3D) – Allows for further positioning of the label from an edge, by default
UR.buff (float) – The distance of the label from the line.
kwargs (Any)
- Returns:
The positioned label.
- Return type:
Examples
Example: GetXAxisLabelExample 
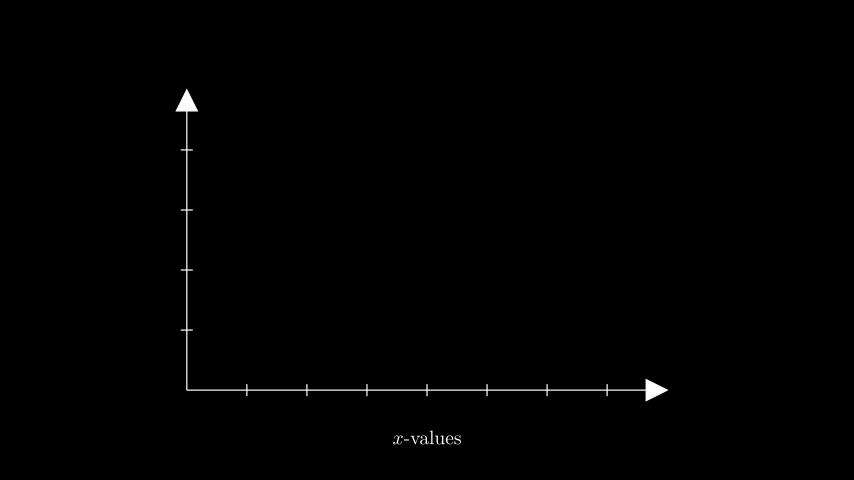
from manim import *

class GetXAxisLabelExample(Scene):
    def construct(self):
        ax = Axes(x_range=(0, 8), y_range=(0, 5), x_length=8, y_length=5)
        x_label = ax.get_x_axis_label(
            Tex("$x$-values").scale(0.65), edge=DOWN, direction=DOWN, buff=0.5
        )
        self.add(ax, x_label)
class GetXAxisLabelExample(Scene):
    def construct(self):
        ax = Axes(x_range=(0, 8), y_range=(0, 5), x_length=8, y_length=5)
        x_label = ax.get_x_axis_label(
            Tex("$x$-values").scale(0.65), edge=DOWN, direction=DOWN, buff=0.5
        )
        self.add(ax, x_label)
- get_y_axis_label(label, edge=array([1., 1., 0.]), direction=array([1., 0.5, 0.]), buff=0.1, **kwargs)[source]
Generate a y-axis label.
- Parameters:
label (float | str | VMobject) – The label. Defaults to
MathTexforstrandfloatinputs.edge (Vector3D) – The edge of the y-axis to which the label will be added, by default
UR.direction (Vector3D) – Allows for further positioning of the label from an edge, by default
URbuff (float) – The distance of the label from the line.
kwargs (Any)
- Returns:
The positioned label.
- Return type:
Examples
Example: GetYAxisLabelExample 
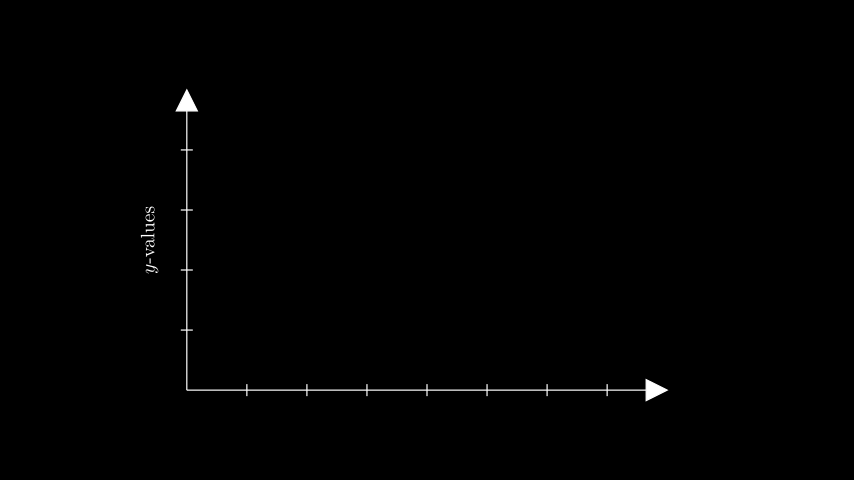
from manim import *

class GetYAxisLabelExample(Scene):
    def construct(self):
        ax = Axes(x_range=(0, 8), y_range=(0, 5), x_length=8, y_length=5)
        y_label = ax.get_y_axis_label(
            Tex("$y$-values").scale(0.65).rotate(90 * DEGREES),
            edge=LEFT,
            direction=LEFT,
            buff=0.3,
        )
        self.add(ax, y_label)
- i2gc(x, graph)[source]
Alias for
input_to_graph_coords().- Parameters:
x (float)
graph (ParametricFunction)
- Return type:
tuple[float, float]
- i2gp(x, graph)[source]
Alias for
input_to_graph_point().- Parameters:
x (float)
graph (ParametricFunction)
- Return type:
ndarray
- input_to_graph_coords(x, graph)[source]
Returns a tuple of the axis relative coordinates of the point on the graph based on the x-value given.
Examples
>>> from manim import Axes
>>> ax = Axes()
>>> parabola = ax.plot(lambda x: x**2)
>>> ax.input_to_graph_coords(x=3, graph=parabola)
(3, 9)
- Parameters:
x (float)
graph (ParametricFunction)
- Return type:
tuple[float, float]
- input_to_graph_point(x, graph)[source]
Returns the coordinates of the point on a
graphcorresponding to anxvalue.- Parameters:
x (float) – The x-value of a point on the
graph.graph (ParametricFunction | VMobject) – The
ParametricFunctionon which the point lies.
- Returns:
The coordinates of the point on the
graphcorresponding to thexvalue.- Return type:
np.ndarray- Raises:
ValueError – When the target x is not in the range of the line graph.
Examples
Example: InputToGraphPointExample 
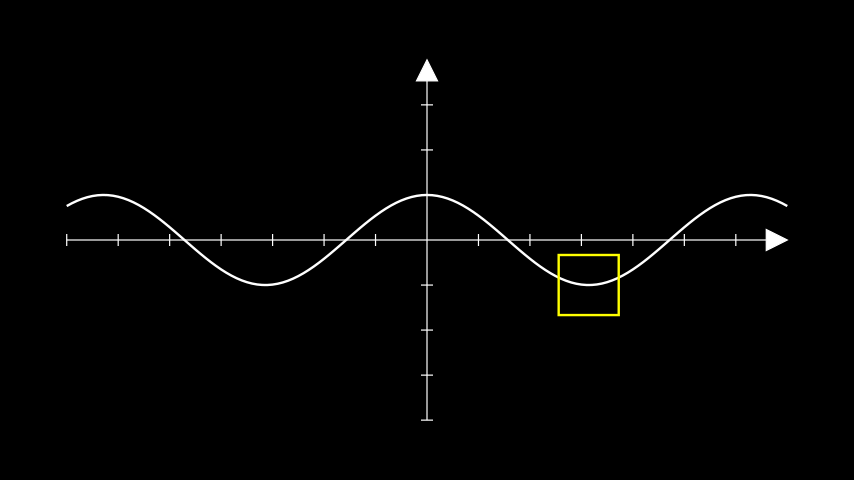
from manim import *

class InputToGraphPointExample(Scene):
    def construct(self):
        ax = Axes()
        curve = ax.plot(lambda x : np.cos(x))

        # move a square to PI on the cosine curve.
        position = ax.input_to_graph_point(x=PI, graph=curve)
        sq = Square(side_length=1, color=YELLOW).move_to(position)

        self.add(ax, curve, sq)
- p2c(point)[source]
Abbreviation for
point_to_coords()- Parameters:
point (Point3DLike)
- Return type:
list[TypeAliasForwardRef(‘~manim.typing.ManimFloat’)]
- plot(function, x_range=None, use_vectorized=False, colorscale=None, colorscale_axis=1, **kwargs)[source]
Generates a curve based on a function.
- Parameters:
function (Callable[[float], float]) – The function used to construct the
ParametricFunction.x_range (Sequence[float] | None) – The range of the curve along the axes.
x_range = [x_min, x_max, x_step].use_vectorized (bool) – Whether to pass in the generated t value array to the function. Only use this if your function supports it. Output should be a numpy array of shape
[y_0, y_1, ...]colorscale (Iterable[TypeAliasForwardRef('~manim.utils.color.core.ParsableManimColor')] | Iterable[TypeAliasForwardRef('~manim.utils.color.core.ParsableManimColor'), float] | None) – Colors of the function. Optional parameter used when coloring a function by values. Passing a list of colors and a colorscale_axis will color the function by y-value. Passing a list of tuples in the form
(color, pivot)allows user-defined pivots where the color transitions.colorscale_axis (int) – Defines the axis on which the colorscale is applied (0 = x, 1 = y), default is y-axis (1).
kwargs (Any) – Additional parameters to be passed to
ParametricFunction.
- Returns:
The plotted curve.
- Return type:
Warning
This method may not produce accurate graphs since Manim currently relies on interpolation between evenly-spaced samples of the curve, instead of intelligent plotting. See the example below for some solutions to this problem.
Examples
Example: PlotExample 
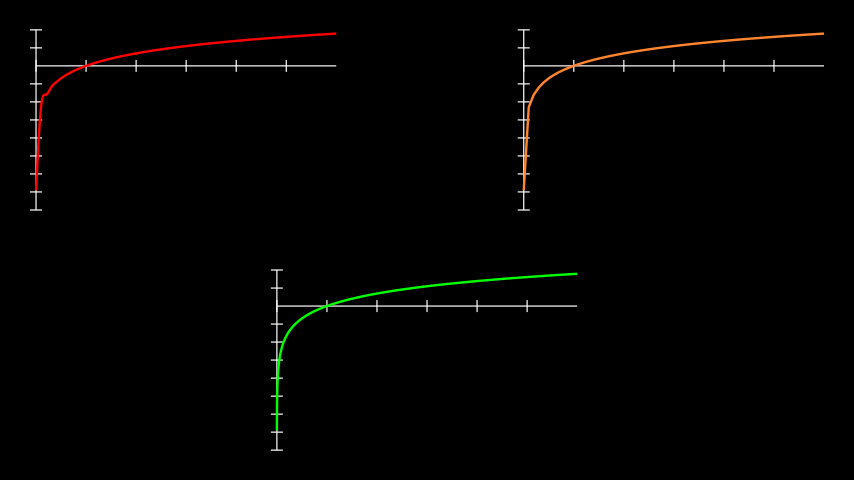
from manim import *

class PlotExample(Scene):
    def construct(self):
        # construct the axes
        ax_1 = Axes(
            x_range=[0.001, 6],
            y_range=[-8, 2],
            x_length=5,
            y_length=3,
            tips=False,
        )
        ax_2 = ax_1.copy()
        ax_3 = ax_1.copy()

        # position the axes
        ax_1.to_corner(UL)
        ax_2.to_corner(UR)
        ax_3.to_edge(DOWN)
        axes = VGroup(ax_1, ax_2, ax_3)

        # create the logarithmic curves
        def log_func(x):
            return np.log(x)

        # a curve without adjustments; poor interpolation.
        curve_1 = ax_1.plot(log_func, color=PURE_RED)

        # disabling interpolation makes the graph look choppy as not enough
        # inputs are available
        curve_2 = ax_2.plot(log_func, use_smoothing=False, color=ORANGE)

        # taking more inputs of the curve by specifying a step for the
        # x_range yields expected results, but increases rendering time.
        curve_3 = ax_3.plot(
            log_func, x_range=(0.001, 6, 0.001), color=PURE_GREEN
        )

        curves = VGroup(curve_1, curve_2, curve_3)

        self.add(axes, curves)
- plot_antiderivative_graph(graph, y_intercept=0, samples=50, use_vectorized=False, **kwargs)[source]
Plots an antiderivative graph.
- Parameters:
graph (ParametricFunction) – The graph for which the antiderivative will be found.
y_intercept (float) – The y-value at which the graph intercepts the y-axis.
samples (int) – The number of points to take the area under the graph.
use_vectorized (bool) – Whether to use the vectorized version of the antiderivative. This means to pass in the generated t value array to the function. Only use this if your function supports it. Output should be a numpy array of shape
[y_0, y_1, ...]kwargs (Any) – Any valid keyword argument of
ParametricFunction.
- Returns:
The curve of the antiderivative.
- Return type:
Note
This graph is plotted from the values of area under the reference graph. The result might not be ideal if the reference graph contains uncalculatable areas from x=0.
Examples
Example: AntiderivativeExample 
from manim import *

class AntiderivativeExample(Scene):
    def construct(self):
        ax = Axes()
        graph1 = ax.plot(
            lambda x: (x ** 2 - 2) / 3,
            color=RED,
        )
        graph2 = ax.plot_antiderivative_graph(graph1, color=BLUE)
        self.add(ax, graph1, graph2)
class AntiderivativeExample(Scene):
    def construct(self):
        ax = Axes()
        graph1 = ax.plot(
            lambda x: (x ** 2 - 2) / 3,
            color=RED,
        )
        graph2 = ax.plot_antiderivative_graph(graph1, color=BLUE)
        self.add(ax, graph1, graph2)
- plot_derivative_graph(graph, color=ManimColor('#83C167'), **kwargs)[source]
Returns the curve of the derivative of the passed graph.
- Parameters:
graph (ParametricFunction) – The graph for which the derivative will be found.
color (ParsableManimColor) – The color of the derivative curve.
kwargs (Any) – Any valid keyword argument of
ParametricFunction.
- Returns:
The curve of the derivative.
- Return type:
Examples
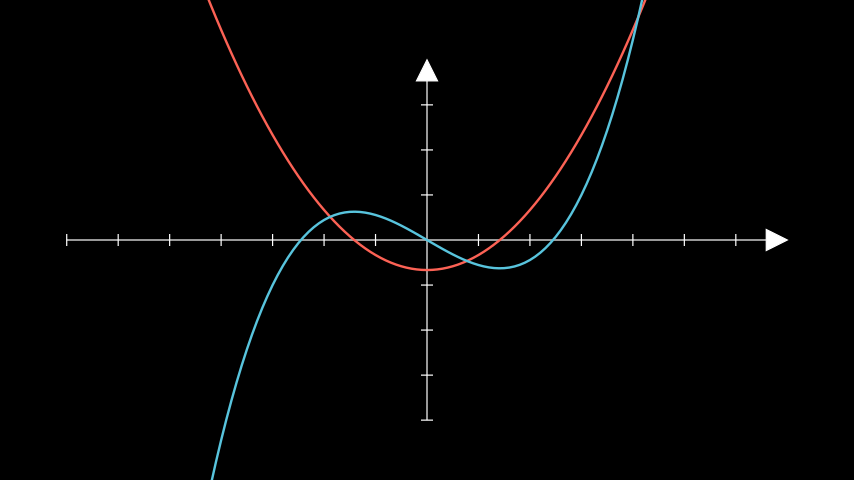
Example: DerivativeGraphExample 
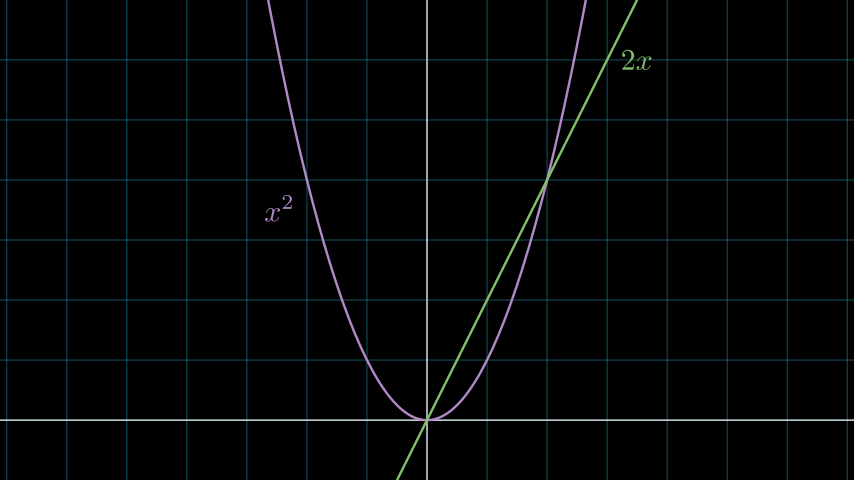
from manim import *

class DerivativeGraphExample(Scene):
    def construct(self):
        ax = NumberPlane(y_range=[-1, 7], background_line_style={"stroke_opacity": 0.4})

        curve_1 = ax.plot(lambda x: x ** 2, color=PURPLE_B)
        curve_2 = ax.plot_derivative_graph(curve_1)
        curves = VGroup(curve_1, curve_2)

        label_1 = ax.get_graph_label(curve_1, "x^2", x_val=-2, direction=DL)
        label_2 = ax.get_graph_label(curve_2, "2x", x_val=3, direction=RIGHT)
        labels = VGroup(label_1, label_2)

        self.add(ax, curves, labels)
- plot_implicit_curve(func, min_depth=5, max_quads=1500, **kwargs)[source]
Creates the curves of an implicit function.
- Parameters:
func (Callable[[float, float], float]) – The function to graph, in the form of f(x, y) = 0.
min_depth (int) – The minimum depth of the function to calculate.
max_quads (int) – The maximum number of quads to use.
kwargs (Any) – Additional parameters to pass into
ImplicitFunction.
- Return type:
Examples
Example: ImplicitExample 
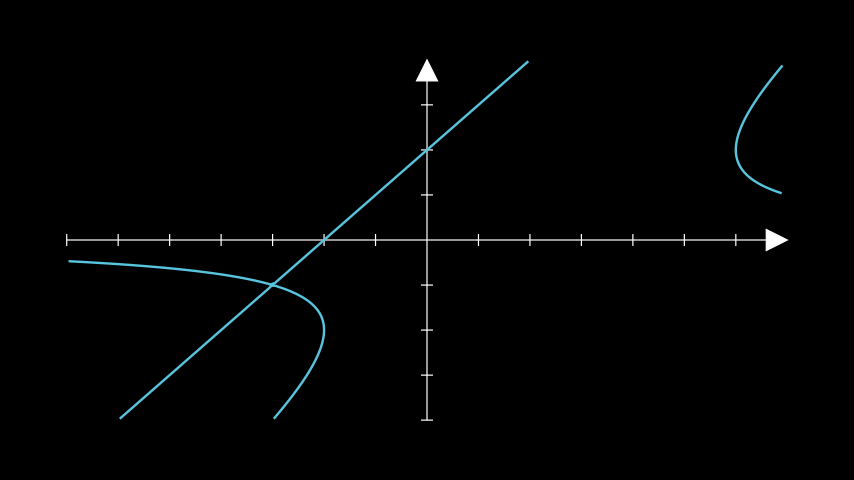
from manim import *

class ImplicitExample(Scene):
    def construct(self):
        ax = Axes()
        a = ax.plot_implicit_curve(
            lambda x, y: y * (x - y) ** 2 - 4 * x - 8, color=BLUE
        )
        self.add(ax, a)
class ImplicitExample(Scene):
    def construct(self):
        ax = Axes()
        a = ax.plot_implicit_curve(
            lambda x, y: y * (x - y) ** 2 - 4 * x - 8, color=BLUE
        )
        self.add(ax, a)
- plot_parametric_curve(function, use_vectorized=False, **kwargs)[source]
A parametric curve.
- Parameters:
function (Callable[[float], ndarray]) – A parametric function mapping a number to a point in the coordinate system.
use_vectorized (bool) – Whether to pass in the generated t value array to the function. Only use this if your function supports it.
kwargs (Any) – Any further keyword arguments are passed to
ParametricFunction.
- Return type:
Example
Example: ParametricCurveExample 
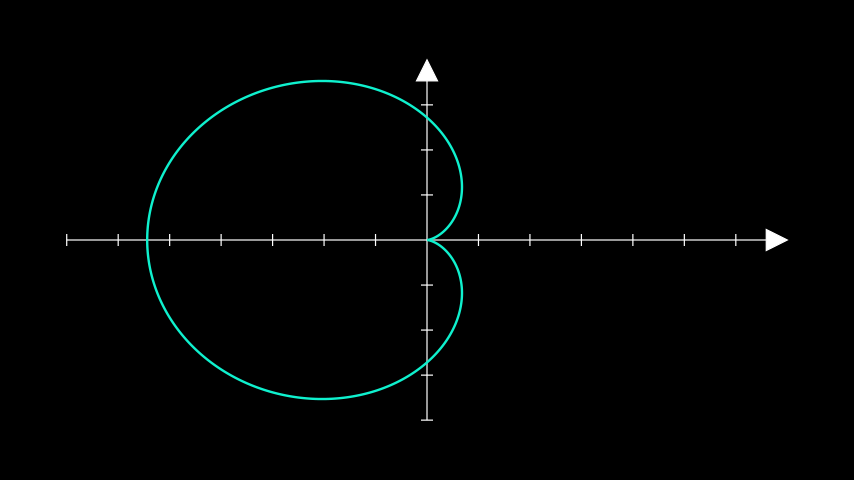
from manim import *

class ParametricCurveExample(Scene):
    def construct(self):
        ax = Axes()
        cardioid = ax.plot_parametric_curve(
            lambda t: np.array(
                [
                    np.exp(1) * np.cos(t) * (1 - np.cos(t)),
                    np.exp(1) * np.sin(t) * (1 - np.cos(t)),
                    0,
                ]
            ),
            t_range=[0, 2 * PI],
            color="#0FF1CE",
        )
        self.add(ax, cardioid)
- plot_polar_graph(r_func, theta_range=None, **kwargs)[source]
A polar graph.
- Parameters:
r_func (Callable[[float], float]) – The function r of theta.
theta_range (Sequence[float] | None) – The range of theta as
theta_range = [theta_min, theta_max, theta_step].kwargs (Any) – Additional parameters passed to
ParametricFunction.
- Return type:
Examples
Example: PolarGraphExample 
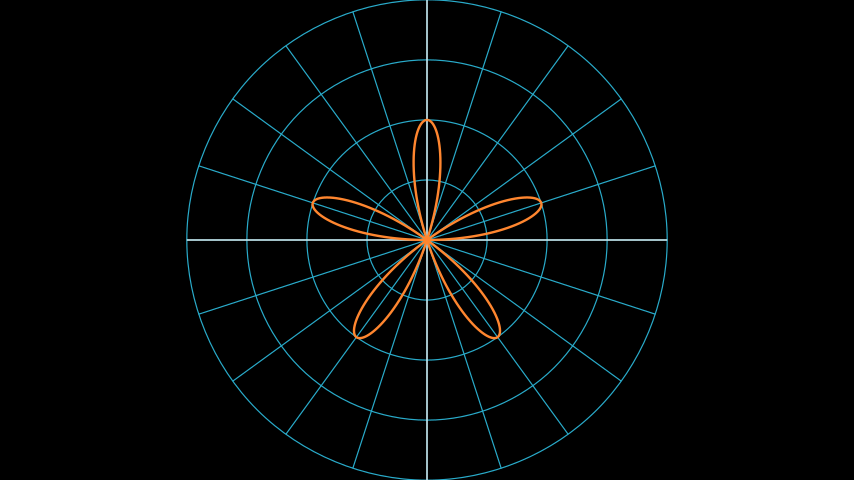
from manim import *

class PolarGraphExample(Scene):
    def construct(self):
        plane = PolarPlane()
        r = lambda theta: 2 * np.sin(theta * 5)
        graph = plane.plot_polar_graph(r, [0, 2 * PI], color=ORANGE)
        self.add(plane, graph)
class PolarGraphExample(Scene):
    def construct(self):
        plane = PolarPlane()
        r = lambda theta: 2 * np.sin(theta * 5)
        graph = plane.plot_polar_graph(r, [0, 2 * PI], color=ORANGE)
        self.add(plane, graph)
References:
PolarPlane
- plot_surface(function, u_range=None, v_range=None, colorscale=None, colorscale_axis=2, **kwargs)[source]
Generates a surface based on a function.
- Parameters:
function (Callable[[float], float]) – The function used to construct the
Surface.u_range (Sequence[float] | None) – The range of the
uvariable:(u_min, u_max).v_range (Sequence[float] | None) – The range of the
vvariable:(v_min, v_max).colorscale (Sequence[TypeAliasForwardRef('~manim.utils.color.core.ParsableManimColor')] | Sequence[tuple[TypeAliasForwardRef('~manim.utils.color.core.ParsableManimColor'), float]] | None) – Colors of the surface. Passing a list of colors will color the surface by z-value. Passing a list of tuples in the form
(color, pivot)allows user-defined pivots where the color transitions.colorscale_axis (int) – Defines the axis on which the colorscale is applied (0 = x, 1 = y, 2 = z), default is z-axis (2).
kwargs (Any) – Additional parameters to be passed to
Surface.
- Returns:
The plotted surface.
- Return type:
Examples
Example: PlotSurfaceExample 
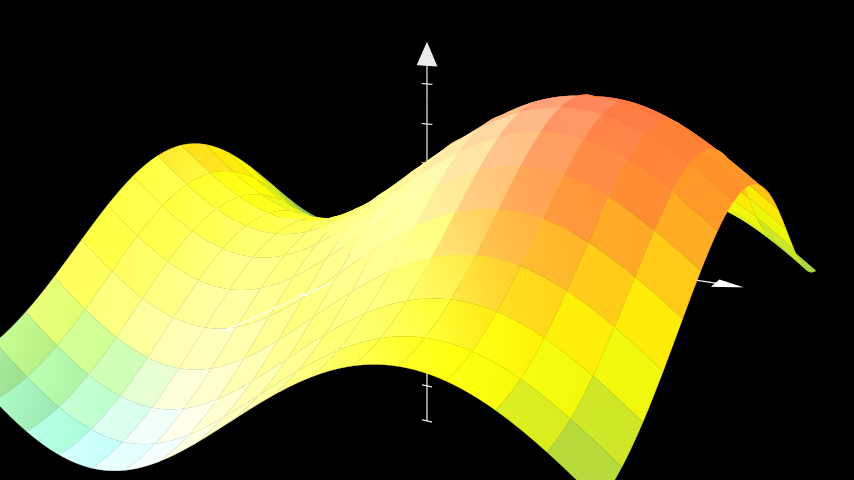
from manim import *

class PlotSurfaceExample(ThreeDScene):
    def construct(self):
        resolution_fa = 16
        self.set_camera_orientation(phi=75 * DEGREES, theta=-60 * DEGREES)
        axes = ThreeDAxes(x_range=(-3, 3, 1), y_range=(-3, 3, 1), z_range=(-5, 5, 1))
        def param_trig(u, v):
            x = u
            y = v
            z = 2 * np.sin(x) + 2 * np.cos(y)
            return z
        trig_plane = axes.plot_surface(
            param_trig,
            resolution=(resolution_fa, resolution_fa),
            u_range = (-3, 3),
            v_range = (-3, 3),
            colorscale = [BLUE, GREEN, YELLOW, ORANGE, RED],
            )
        self.add(axes, trig_plane)
- point_to_polar(point)[source]
Gets polar coordinates from a point.
- Parameters:
point (Point2DLike) – The point.
- Returns:
The coordinate radius (\(r\)) and the coordinate azimuth (\(\theta\)).
- Return type:
- polar_to_point(radius, azimuth)[source]
Gets a point from polar coordinates.
- Parameters:
radius (float) – The coordinate radius (\(r\)).
azimuth (float) – The coordinate azimuth (\(\theta\)).
- Returns:
The point.
- Return type:
numpy.ndarray
Examples
Example: PolarToPointExample 
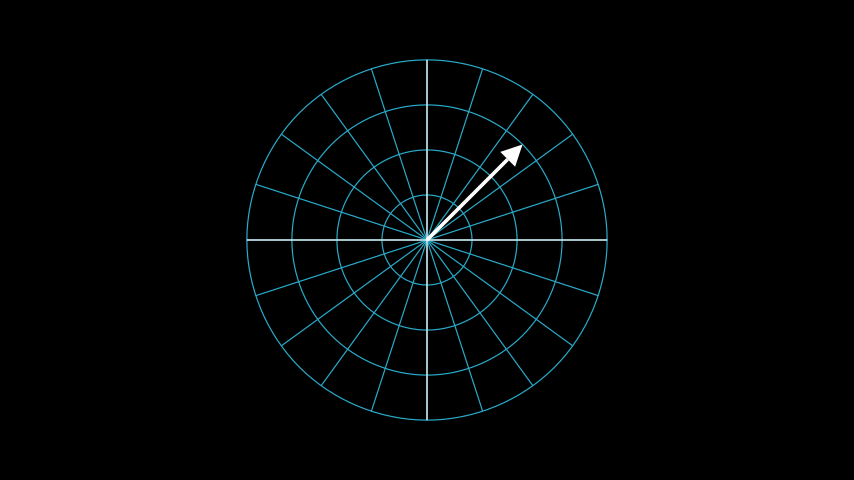
from manim import *

class PolarToPointExample(Scene):
    def construct(self):
        polarplane_pi = PolarPlane(azimuth_units="PI radians", size=6)
        polartopoint_vector = Vector(polarplane_pi.polar_to_point(3, PI/4))
        self.add(polarplane_pi)
        self.add(polartopoint_vector)
class PolarToPointExample(Scene):
    def construct(self):
        polarplane_pi = PolarPlane(azimuth_units="PI radians", size=6)
        polartopoint_vector = Vector(polarplane_pi.polar_to_point(3, PI/4))
        self.add(polarplane_pi)
        self.add(polartopoint_vector)
References:
PolarPlaneVector
- pr2pt(radius, azimuth)[source]
Abbreviation for
polar_to_point()- Parameters:
radius (float)
azimuth (float)
- Return type:
ndarray
- pt2pr(point)[source]
Abbreviation for
point_to_polar()- Parameters:
point (ndarray)
- Return type:
- slope_of_tangent(x, graph, **kwargs)[source]
Returns the slope of the tangent to the plotted curve at a particular x-value.
- Parameters:
x (float) – The x-value at which the tangent must touch the curve.
graph (ParametricFunction) – The
ParametricFunctionfor which to calculate the tangent.kwargs (Any)
- Returns:
The slope of the tangent with the x axis.
- Return type:
float
Examples
ax = Axes()
curve = ax.plot(lambda x: x**2)
ax.slope_of_tangent(x=-2, graph=curve)
# -3.5000000259052038