ParametricFunction
Qualified name: manim.mobject.graphing.functions.ParametricFunction
- class ParametricFunction(function, t_range=(0, 1), scaling=<manim.mobject.graphing.scale.LinearBase object>, dt=1e-08, discontinuities=None, use_smoothing=True, use_vectorized=False, **kwargs)[source]
Bases:
VMobjectA parametric curve.
- Parameters:
function (Callable[[float], Point3DLike]) – The function to be plotted in the form of
(lambda t: (x(t), y(t), z(t)))t_range (tuple[float, float] | tuple[float, float, float]) – Determines the length that the function spans in the form of (t_min, t_max, step=0.01). By default
[0, 1]scaling (_ScaleBase) – Scaling class applied to the points of the function. Default of
LinearBase.use_smoothing (bool) – Whether to interpolate between the points of the function after they have been created. (Will have odd behaviour with a low number of points)
use_vectorized (bool) – Whether to pass in the generated t value array to the function as
[t_0, t_1, ...]. Only use this if your function supports it. Output should be a numpy array of shape[[x_0, x_1, ...], [y_0, y_1, ...], [z_0, z_1, ...]]butzcan also be 0 if the Axes is 2Ddiscontinuities (Iterable[float] | None) – Values of t at which the function experiences discontinuity.
dt (float) – The left and right tolerance for the discontinuities.
kwargs (Any)
Examples
Example: PlotParametricFunction 

from manim import *

class PlotParametricFunction(Scene):
    def func(self, t):
        return (np.sin(2 * t), np.sin(3 * t), 0)

    def construct(self):
        func = ParametricFunction(self.func, t_range = (0, TAU), fill_opacity=0).set_color(RED)
        self.add(func.scale(3))
class PlotParametricFunction(Scene):
    def func(self, t):
        return (np.sin(2 * t), np.sin(3 * t), 0)

    def construct(self):
        func = ParametricFunction(self.func, t_range = (0, TAU), fill_opacity=0).set_color(RED)
        self.add(func.scale(3))
Example: ThreeDParametricSpring 
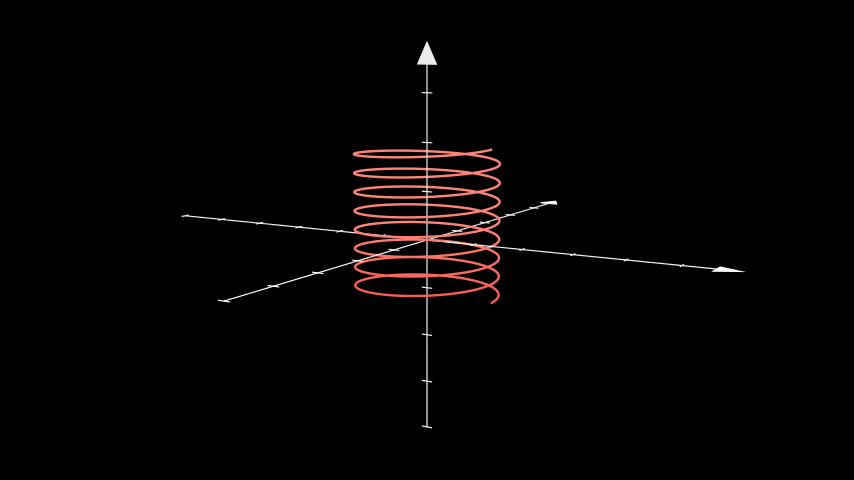
from manim import *

class ThreeDParametricSpring(ThreeDScene):
    def construct(self):
        curve1 = ParametricFunction(
            lambda u: (
                1.2 * np.cos(u),
                1.2 * np.sin(u),
                u * 0.05
            ), color=RED, t_range = (-3*TAU, 5*TAU, 0.01)
        ).set_shade_in_3d(True)
        axes = ThreeDAxes()
        self.add(axes, curve1)
        self.set_camera_orientation(phi=80 * DEGREES, theta=-60 * DEGREES)
        self.wait()
Attention
If your function has discontinuities, you’ll have to specify the location of the discontinuities manually. See the following example for guidance.
Example: DiscontinuousExample 
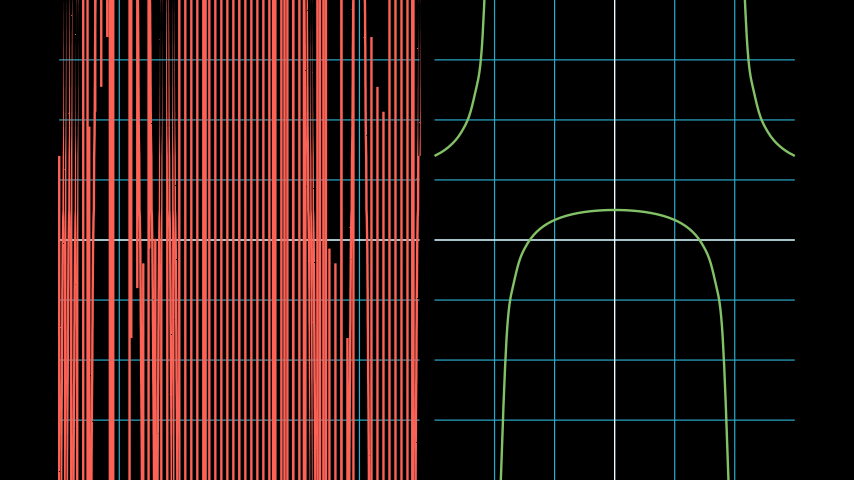
from manim import *

class DiscontinuousExample(Scene):
    def construct(self):
        ax1 = NumberPlane((-3, 3), (-4, 4))
        ax2 = NumberPlane((-3, 3), (-4, 4))
        VGroup(ax1, ax2).arrange()
        discontinuous_function = lambda x: (x ** 2 - 2) / (x ** 2 - 4)
        incorrect = ax1.plot(discontinuous_function, color=RED)
        correct = ax2.plot(
            discontinuous_function,
            discontinuities=[-2, 2],  # discontinuous points
            dt=0.1,  # left and right tolerance of discontinuity
            color=GREEN,
        )
        self.add(ax1, ax2, incorrect, correct)
Methods
Initializes
pointsand therefore the shape.get_functionget_point_from_functioninit_pointsAttributes
alwaysCall a method on a mobject every frame.
animateUsed to animate the application of any method of
self.animation_overridescolordepthThe depth of the mobject.
fill_colorIf there are multiple colors (for gradient) this returns the first one
heightThe height of the mobject.
n_points_per_curvesheen_factorstroke_colorwidthThe width of the mobject.
- _original__init__(function, t_range=(0, 1), scaling=<manim.mobject.graphing.scale.LinearBase object>, dt=1e-08, discontinuities=None, use_smoothing=True, use_vectorized=False, **kwargs)
Initialize self. See help(type(self)) for accurate signature.
- Parameters:
function (Callable[[float], Point3DLike])
t_range (tuple[float, float] | tuple[float, float, float])
scaling (_ScaleBase)
dt (float)
discontinuities (Iterable[float] | None)
use_smoothing (bool)
use_vectorized (bool)
kwargs (Any)