BarChart
Qualified name: manim.mobject.graphing.probability.BarChart
- class BarChart(values, bar_names=None, y_range=None, x_length=None, y_length=None, bar_colors=['#003f5c', '#58508d', '#bc5090', '#ff6361', '#ffa600'], bar_width=0.6, bar_fill_opacity=0.7, bar_stroke_width=3, **kwargs)[source]
Bases:
AxesCreates a bar chart. Inherits from
Axes, so it shares its methods and attributes. Each axis inherits fromNumberLine, so pass inx_axis_config/y_axis_configto control their attributes.- Parameters:
values (MutableSequence[float]) – A sequence of values that determines the height of each bar. Accepts negative values.
bar_names (Sequence[str] | None) – A sequence of names for each bar. Does not have to match the length of
values.y_range (Sequence[float] | None) – The y_axis range of values. If
None, the range will be calculated based on the min/max ofvaluesand the step will be calculated based ony_length.x_length (float | None) – The length of the x-axis. If
None, it is automatically calculated based on the number of values and the width of the screen.y_length (float | None) – The length of the y-axis.
bar_colors (Iterable[str]) – The color for the bars. Accepts a sequence of colors (can contain just one item). If the length of``bar_colors`` does not match that of
values, intermediate colors will be automatically determined.bar_width (float) – The length of a bar. Must be between 0 and 1.
bar_fill_opacity (float) – The fill opacity of the bars.
bar_stroke_width (float) – The stroke width of the bars.
kwargs (Any)
Examples
Example: BarChartExample 
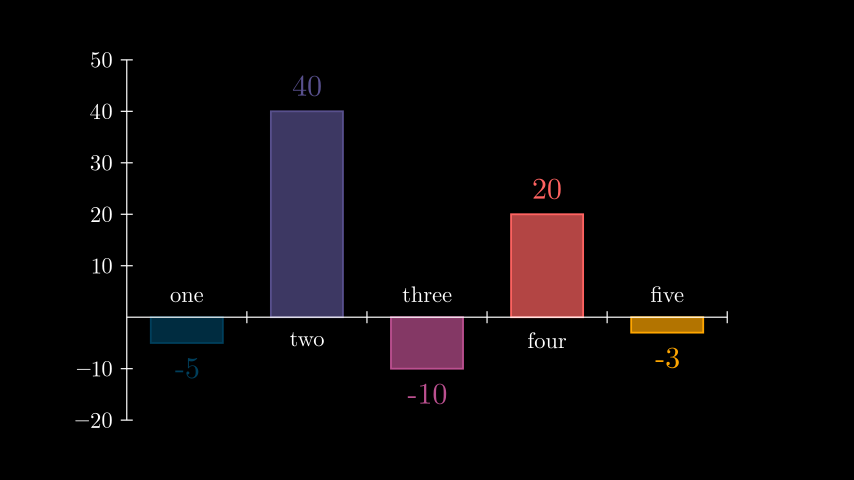
from manim import *

class BarChartExample(Scene):
    def construct(self):
        chart = BarChart(
            values=[-5, 40, -10, 20, -3],
            bar_names=["one", "two", "three", "four", "five"],
            y_range=[-20, 50, 10],
            y_length=6,
            x_length=10,
            x_axis_config={"font_size": 36},
        )

        c_bar_lbls = chart.get_bar_labels(font_size=48)

        self.add(chart, c_bar_lbls)
Methods
Updates the height of the bars of the chart.
Annotates each bar with its corresponding value.
Attributes
alwaysCall a method on a mobject every frame.
animateUsed to animate the application of any method of
self.animation_overridescolordepthThe depth of the mobject.
fill_colorIf there are multiple colors (for gradient) this returns the first one
heightThe height of the mobject.
n_points_per_curvesheen_factorstroke_colorwidthThe width of the mobject.
- _add_x_axis_labels()[source]
Essentially :meth`:~.NumberLine.add_labels`, but differs in that the direction of the label with respect to the x_axis changes to UP or DOWN depending on the value.
UP for negative values and DOWN for positive values.
- Return type:
None
- _create_bar(bar_number, value)[source]
Creates a positioned bar on the chart.
- Parameters:
bar_number (int) – Determines the x-position of the bar.
value (float) – The value that determines the height of the bar.
- Returns:
A positioned rectangle representing a bar on the chart.
- Return type:
- _original__init__(values, bar_names=None, y_range=None, x_length=None, y_length=None, bar_colors=['#003f5c', '#58508d', '#bc5090', '#ff6361', '#ffa600'], bar_width=0.6, bar_fill_opacity=0.7, bar_stroke_width=3, **kwargs)
Initialize self. See help(type(self)) for accurate signature.
- Parameters:
values (MutableSequence[float])
bar_names (Sequence[str] | None)
y_range (Sequence[float] | None)
x_length (float | None)
y_length (float | None)
bar_colors (Iterable[str])
bar_width (float)
bar_fill_opacity (float)
bar_stroke_width (float)
kwargs (Any)
- _update_colors()[source]
Initialize the colors of the bars of the chart.
Sets the color of
self.barsviaself.bar_colors.Primarily used when the bars are initialized with
self._add_barsor updated viaself.change_bar_values.- Return type:
None
- change_bar_values(values, update_colors=True)[source]
Updates the height of the bars of the chart.
- Parameters:
values (Iterable[float]) – The values that will be used to update the height of the bars. Does not have to match the number of bars.
update_colors (bool) – Whether to re-initalize the colors of the bars based on
self.bar_colors.
- Return type:
None
Examples
Example: ChangeBarValuesExample 
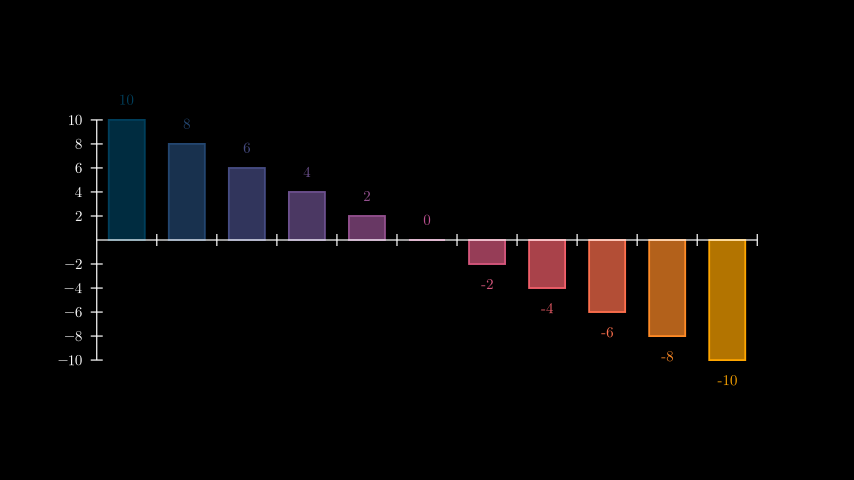
from manim import *

class ChangeBarValuesExample(Scene):
    def construct(self):
        values=[-10, -8, -6, -4, -2, 0, 2, 4, 6, 8, 10]

        chart = BarChart(
            values,
            y_range=[-10, 10, 2],
            y_axis_config={"font_size": 24},
        )
        self.add(chart)

        chart.change_bar_values(list(reversed(values)))
        self.add(chart.get_bar_labels(font_size=24))
- get_bar_labels(color=None, font_size=24, buff=0.25, label_constructor=<class 'manim.mobject.text.tex_mobject.Tex'>)[source]
Annotates each bar with its corresponding value. Use
self.bar_labelsto access the labels after creation.- Parameters:
color (TypeAliasForwardRef('~manim.utils.color.core.ParsableManimColor') | None) – The color of each label. By default
Noneand is based on the parent’s bar color.font_size (float) – The font size of each label.
buff (float) – The distance from each label to its bar. By default 0.4.
label_constructor (type[MathTex]) – The Mobject class to construct the labels, by default
Tex.
- Return type:
Examples
Example: GetBarLabelsExample 
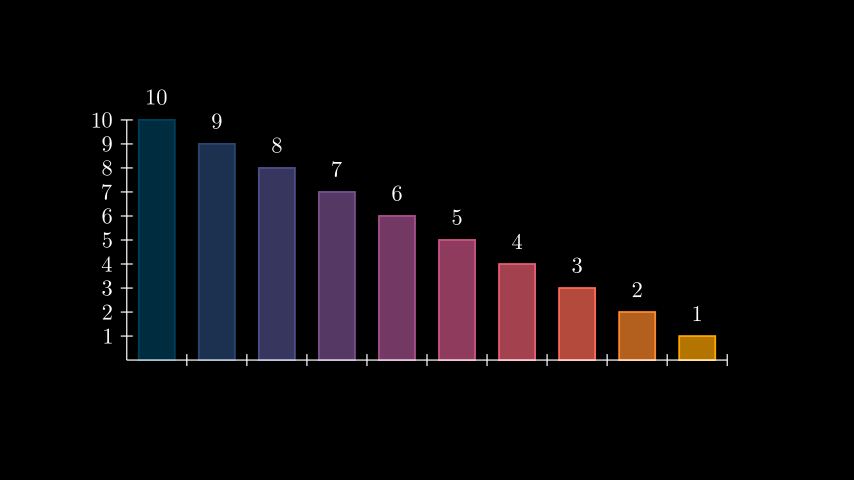
from manim import *

class GetBarLabelsExample(Scene):
    def construct(self):
        chart = BarChart(values=[10, 9, 8, 7, 6, 5, 4, 3, 2, 1], y_range=[0, 10, 1])

        c_bar_lbls = chart.get_bar_labels(
            color=WHITE, label_constructor=MathTex, font_size=36
        )

        self.add(chart, c_bar_lbls)
class GetBarLabelsExample(Scene):
    def construct(self):
        chart = BarChart(values=[10, 9, 8, 7, 6, 5, 4, 3, 2, 1], y_range=[0, 10, 1])

        c_bar_lbls = chart.get_bar_labels(
            color=WHITE, label_constructor=MathTex, font_size=36
        )

        self.add(chart, c_bar_lbls)